
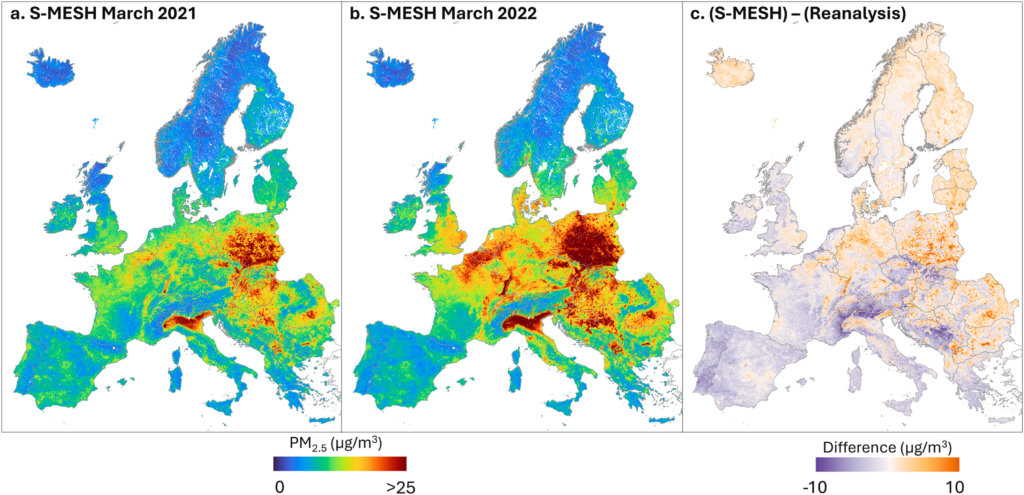
S-MESH (Satellite and ML-based Estimation of Surface air quality at High resolution) is a flexible framework that combines satellite observations with machine learning to estimate surface air quality across Europe. It can produce daily maps of NO2 and PM2.5 at a comparatively high spatial resolution (1 km), providing detailed insights into the distribution of air pollutants over large areas.
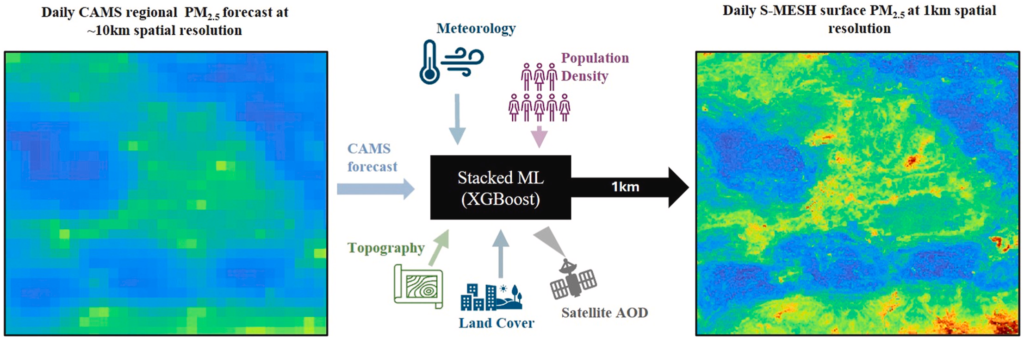
S-MESH integrates data from modern satellite instruments—such as Sentinel-5P’s TROPOMI, which provides measurements of tropospheric nitrogen dioxide (NO₂), and VIIRS, which offers additional inputs like Aerosol Optical Depth or night light radiance. Along with these satellite products, the framework uses meteorological data (temperature, wind speed, planetary boundary layer height), vegetation indices, topographical information, and other relevant spatial datasets. This range of inputs helps the model account for the various factors that influence surface pollutant concentrations.
At its core, S-MESH uses the XGBoost machine learning algorithm to estimate pollutant levels. For PM₂.₅ estimation, the approach employs a stacked modeling strategy that combines multiple XGBoost models. This method improves prediction accuracy and addresses challenges such as data gaps in satellite observations. In addition, explainable AI tools such as SHAP values are used to show how each input contributes to the final air quality estimates.
By providing high-resolution and timely air quality information, S-MESH serves as a valuable tool for researchers, policymakers, and urban planners. Its ability to bridge the gap between coarse regional models and local air quality measurements supports better decision-making for public health and environmental management. Detailed maps of pollutant distributions help in designing targeted interventions and understanding the impact of different emission sources in urban and rural areas.
Main Contact person: Philipp Schneider (ps@nilu.no)
Relevant Links:
2019-2021 NO2 data on Zenodo
2021-2022 PM2.5 data on Zenodo
2021-2022 PM2.5 maps that integrate low-cost sensor information on Zenodo
References:
Shetty, S., Schneider, P., Stebel, K., Hamer, P. D., Kylling, A., & Berntsen, T. K. (2024). Estimating surface NO2 concentrations over Europe using Sentinel-5P TROPOMI observations and Machine Learning. Remote Sensing of Environment, 312, 114321.
Shetty, S., Hamer, P. D., Stebel, K., Kylling, A., Hassani, A., Berntsen, T. K., & Schneider, P. (2025). Daily high-resolution surface PM2. 5 estimation over Europe by ML-based downscaling of the CAMS regional forecast. Environmental Research, 264, 120363.
Shetty, S., Hassani, A., Hamer, P. D., Stebel, K., Salamalikis, V., Berntsen, T. K., Castell, N., and Schneider, P. (2026): Evaluating the role of low-cost sensors in machine learning based European PM2.5 monitoring, Environmental Research, 291, 123558.