
The AirGAM model is an air quality trend and prediction model developed in EEA projects over the years 2017-2021. It is based on GAM (Generalized Additive Modelling) regression for estimating trends in daily observed pollutant concentrations at air quality monitoring stations, adjusting for eventual trends in corresponding meteorological data. The model has been developed primarily for the compounds NO2, O3, PM10 and PM2.5 – but can also be used for other compounds, including VOCs. Input meteorological data consist of temperature, wind speed and direction, planetary boundary layer height, relative and absolute humidity, cloud cover and precipitation over the period considered. The meteorological variables used depends on the compound selected for analysis. In addition to meteorological variables introduced in the model as covariates, i.e., explanatory variables for the levels of concentration, the model also includes time variables such as day of the week, day of the year, and total time, the latter associated with the model’s trend term. The trend analysis is applied individually for each station. Thus, the model only considers the temporal features of concentrations and meteorology at a station and not statistical dependencies between stations.
AirGAM is implemented in R, using, in particular, the GAM package mgcv. In the model, meteorological and time dependencies are estimated as smooth nonlinear functions of the corresponding variables. Thus, the trend term is produced as a smooth nonlinear function of time. After fitting the model to training data, it may be used to predict air pollutant concentrations, e.g. for forecasting purposes.
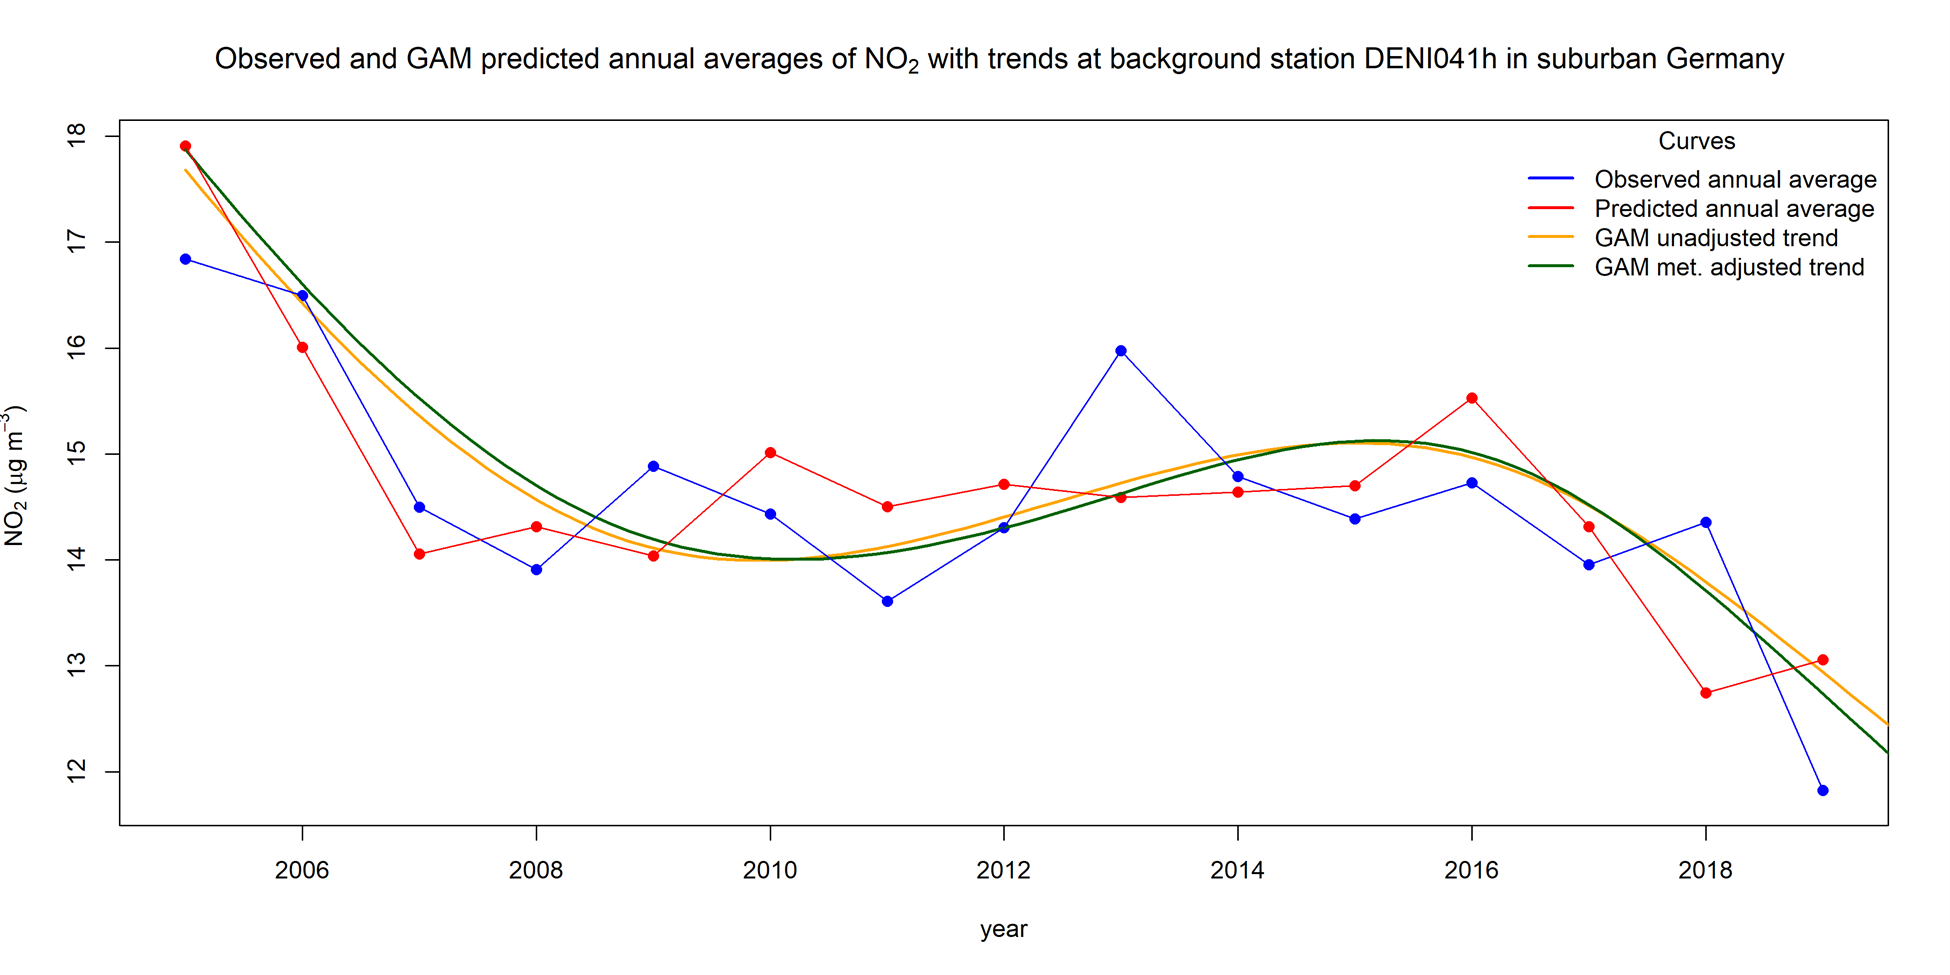
In addition to meteorology adjusted trends, the program may also produce unadjusted trends – i.e., trends using the same regression set-up but applying only the time-related variables. This does not require any meteorological input. Both types of trends can be produced from the model concurrently, making it possible to compare them, as shown in Figure 1 for the station DENI04h. This is a background station in a suburban area of Germany close to the city Rinteln, about 60 km southwest of Hanover. The meteorology adjusted trend on this station show the trend in concentrations mainly due to changes in emissions.
AirGAM has been developed primarily for trend studies based on Airbase/AQER data hosted by EEA. These data provide daily or hourly surface measurements at individual monitoring stations in Europe. For meteorology, we usually use time series from the gridded meteorological re-analysis data ERA5 from ECMWF for each station.
Contact persons
Sam-Erik Walker (sew@nilu.no) (main contact), Sverre Solberg (sso@nilu.no).
Model website
Currently, we do not have a model website.
Model code and data repository
We plan to put the model code with run scripts and examples of input and output data on Zenodo as part of the publication of the model.
References
Walker, S.-E., Solberg, S., Schneider, P., Guerreiro, C.: The AirGAM 2022r1 air quality trend and prediction model. Geosci. Model Dev., 16, 573–595.
Solberg, S., Walker, S.-E., Schneider, P., Guerreiro, C.: Quantifying the impact of the Covid-19 lockdown measures on nitrogen dioxide levels throughout Europe, Atmosphere, 12, 131, doi: /10.3390/atmos12020131, 2021.
Solberg, S., Walker, S-E, Guerreiro, C. and Colette, A.: Statistical modelling for long-term trends of pollutants – Use of a GAM model for the assessment of measurements of O3, NO2 and PM, ETC/ATNI Report 14/2019, 2019.
Solberg., S., Walker, S-E., Schneider, P., Guerreiro, C. and Colette, A.: Discounting the effect of meteorology on trends in surface ozone: Development of statistical tools, ETC/ACM Technical paper 2017/15, 2018a.
Solberg., S., Walker, S-E. and Schneider, P.: Trends in measured NO2 and PM: Discounting the effect of meteorology, Eionet Report – ETC/ACM 2018/9, 2018b.