
Clustering is a powerful analytical technique that has long been used across various fields to unlock insights from data by organising it into meaningful groups or clusters. The goal is to minimise variance within clusters while maximising differences between them. Hierarchical Clustering (HC), one of the most effective clustering methods for exploratory data analysis, stands out as an unsupervised technique—meaning it requires no assumptions about the number of clusters. Unlike K-means, another commonly used clustering method, HC offers the flexibility of discovering clusters without the need for pre-commitment to their quantity. This makes it especially useful for dynamic and complex data analysis. This similarity is scored using the dissimilarity metric, which computes a “distance” between each data element. The process of combining the two most similar data elements requires that the dissimilarity matrix be recomputed for all clusters, linking the newly combined cluster and all the other clusters remaining at that step of clustering. The process is stepwise: each data point starts as its own cluster, and at each step, the two most similar clusters are merged, with a similarity score based on a dissimilarity metric. However, it is essential to note that HC provides qualitative insights influenced by factors like the metric chosen, the number of time series, and the number of data records available.
This method is highly effective for applications such as air quality data analysis, as demonstrated in the work of Soares et al. (2018a,b; 2023), Tarrasón et al. (2020), Hooyberghs et al. (2020). To streamline the application of HC in air quality management, MoNET (Soares et al., 2023), a web-based tool designed for easy use without the need for specialised knowledge in clustering analysis or graphic design, was developed. MoNET helps address key requirements of the EU’s Ambient Air Quality Directive (AAQD) by digesting spatial-temporal data from both observations and models. It supports the design and evaluation of air quality monitoring networks (AQMN), using the hierarchical clustering technique.
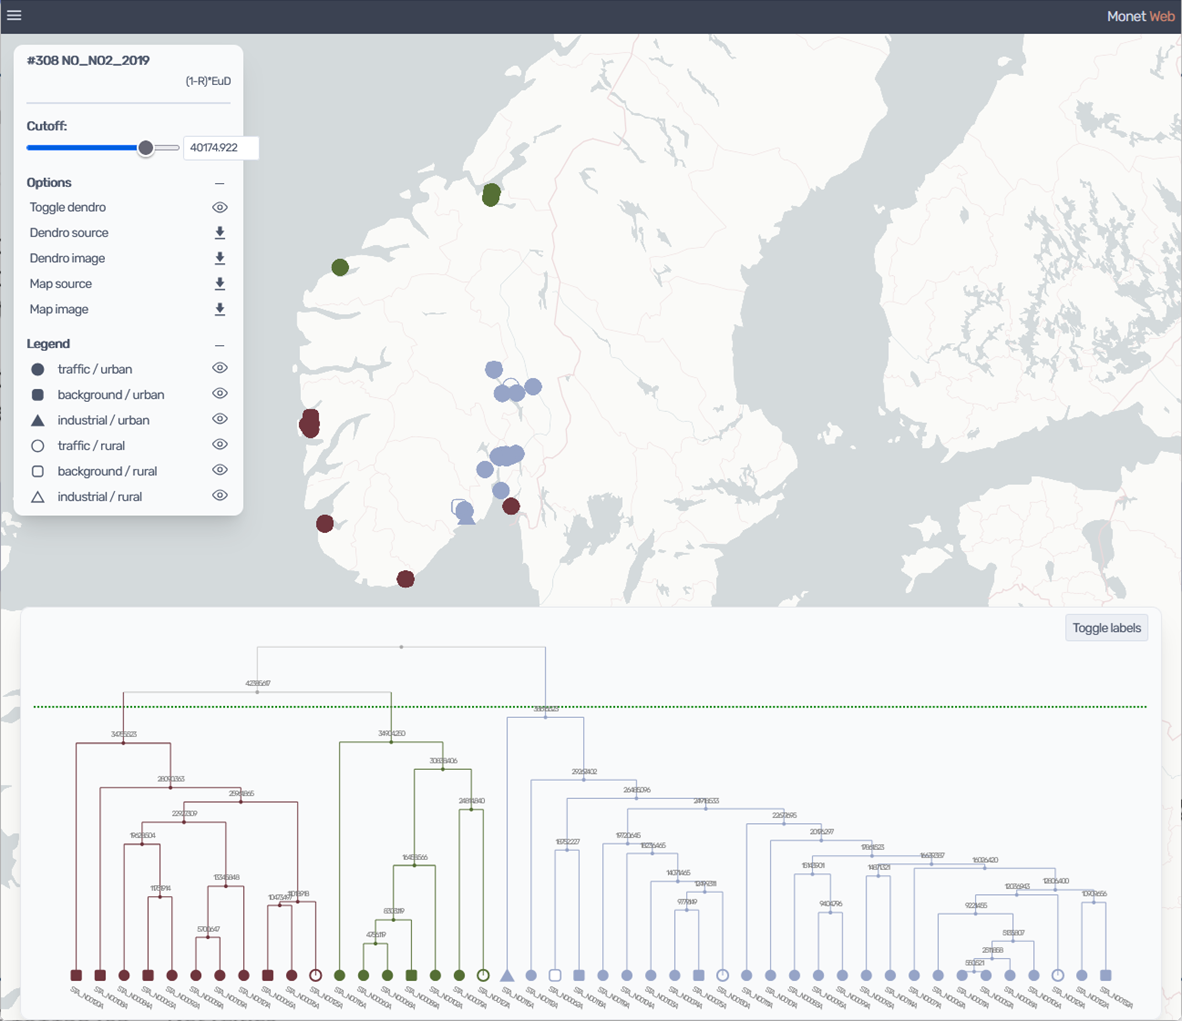
With MoNET, users can:
- Easily compare and identify similarities or differences in time series data from different monitoring stations.
- Perform quick quality control on reported data and evaluate the representativeness of the AQMN for compliance with the AAQD.
- Detect potential data issues or uncover outliers with unique temporal patterns.
- Distinguish pollution sources, whether from high-emission sites, background concentrations, or localised influences.
- Verify the accuracy of monitoring site classifications and improve the definition of air quality zones.
- Optimise and refine monitoring networks for better coverage and efficiency.
MoNET is user-friendly and accessible to everyone. Users can upload their own datasets or access validated data directly from the European Environment Agency download service (https://eeadmz1-downloads-webapp.azurewebsites.net/). The tool allows users to run clustering analyses and visualise the results through interactive maps and dendrograms. One can adjust the clustering parameters, save the results in various formats (PNG, GeoJSON, ASCII), and even customise the level of dissimilarity to fit specific needs.
The application, available here https://dev-monet2.nilu.no, is free and accessible upon request, making MoNET a powerful and flexible tool for anyone involved in air quality management. Whether assessing network performance, revising monitoring strategies, or optimising data presentation, MoNET equips the user with the insights needed to make informed decisions.
Contact person(s):
Joana Soares (jos@nilu.no)
References
Soares, J., Stoll, C., Vallejo, I., Lee, C., Makar, P., and Tarrasón, L., 2023, Applications of an advanced clustering tool for EU AQ monitoring network data analysis, EGU General Assembly 2023, Vienna, Austria, 23–28 Apr 2023, EGU23-15087, https://doi.org/10.5194/egusphere-egu23-15087, 2023.
Soares, J; Aas, Wenche; Eckhardt, S. Guerreiro, Cristina, 2023, Hierarchical Clustering and Dissimilarity Polygon Analyses – Optimising the Polish Deposition Network; NILU report; 33/2022, Kjeller. Link
Tarrasón, L., Claudia Hak, Joana Soares, Håvard Vika Røen, Rune Ødegård and Leif Marsteen, 2020, Assessing the spatial representativeness of air quality sampling point. Application of siting criteria and sampling point classification – Task 3 interim report Service Request 5 under Framework Contract ENV.C.3/FRA/2017/0012 Specific Contract: 07.0203/2018/793545/SFRA/ENV.C.3. Link
Hooyberghs, H., Tarráson, L., Janssen, S., and Soares, S., 2020. Assessing the spatial representativeness of air quality sampling point – Sensitivity and feasibibility tests for a tiered approach – Interim Report Task 1. Service Request 5 under Framework Contract ENV.C.3/FRA/2017/0012 Specific Contract: 07.0203/2018/793545/SFRA/ENV.C.3. Link
Soares, J., Makar, P. A., Aklilu, Y., and Akingunola, A., 2018, The use of hierarchical clustering for the design of optimised monitoring networks, Atmos. Chem. Phys., 18, 65043-6566, https://doi.org/10.5194/acp-18-6543-2018.
Soares, J., Makar, P. A., Aklilu, Y., and Akingunola, A. ., 2018, Hierarchical Clustering Network Analysis of Ambient Air Monitoring in Alberta: Phases 1 and 2, OSM technical report series. Link